In-Depth Analytics and Reporting
The more documentation you create, the happier your users are and the harder it is to manage the documentation process.
With hundreds of documents, can you tell exactly how ready they are? Is there a bottleneck in your team productivity? Do you know how well your published documentation is performing?
In any documentation team those are complex, but important questions to answer.
In ClickHelp, we are commited to give you the tools of efficient management and analysis of your documentation process.
We offer a range of powerful features including advanced analytics. While all Search Queries can be viewed in GA4, if you need even more results, we have them available to you.
Report Center
This is the place where you can get a bird’s eye view of analytics and statistics for the whole portal, project or even a single topic.
ClickHelp offers over a dozen of reports with advanced filtering and drilldown mode - your projects readiness, content quality metrics and user behavior analytics.
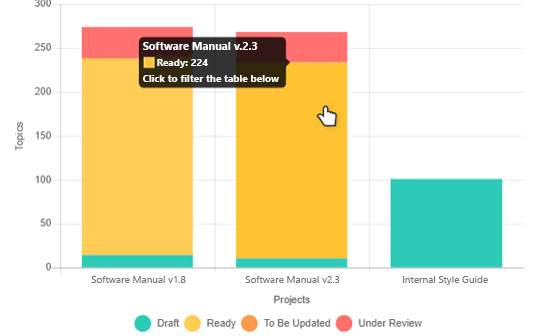
Project Readiness
See breakdown by status or assignee, find out how many topics are stuck in the review process, who has too many tasks piled on their shoulders, how much content has been created by each contributor.
ClickHelp reports provide you with actionable data - you know what to fix and who needs help to move the project forward.
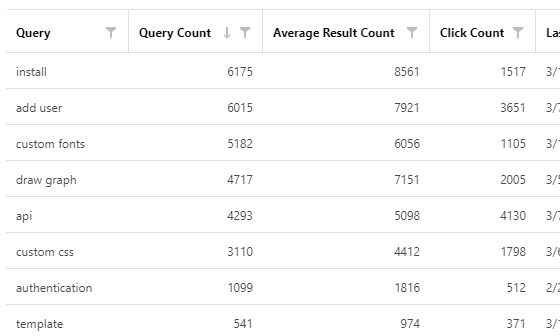
User Behavior Analytics
ClickHelp collects statistical data on how your readers interact with your documentation portal: what they read, what they like, whether they find what they are looking for,
which of your topics are most popular, which keywords are right, etc. For those who look for more details, ClickHelp provides detailed analytics with report drilldown mode.
This information will help you continiuosly improve your user documentation and make it more efficient.
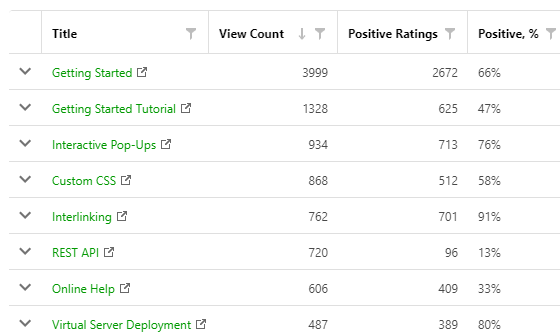
User Feedback
You can communicate with your readers to get more information on your content quality. While browsing a topic, they can vote for its helpfulness or leave comments.
In the Report Center you can see how many upvotes and downvotes a specific topic received and what people think about the content. This will help you spot problematic topics that are confusing or lack the info your users are looking for.
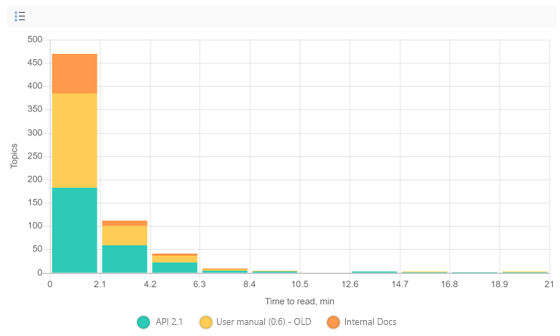
Readability
Technical writers want their content to be easy to read. Readability is exactly the metric to measure that.
ClickHelp automatically calculates estimated time to read and 9 other popular readability scores for your content, like Flesch reading ease, Flesch-Kincaid Grade Level and others.
This way you can ensure a high level of readability for your content. With over 30 metrics available in ClickHelp, it’s easy to manage your documentation quality.
ClickHelp can generate printable versions of all the reports so you can have them at hand. Supported export formats include PDF, XLS/XLSX (Microsoft Excel), CSV and RTF
The information provided by Report Center helps you stay on top of your documentation processes.
Get a quick overview of the documentation project readiness, the readability of your content, the most popular articles people read, or dive deep into analysis with detailed reports.
This is important not only for product managers or technical writing leads, but also for technical writers in their daily work.
Easy Navigation and Full-Text Search
Patented Full-Text Search engine, adapted for documentation search and lots of navitation options for your readers comfort.
Read more about it
Security and Reliability
Security of our customer data along with reliability of our services are one of our top priorities.
Read more about it